Tag Archives: Tutorial

Python with Arduino LESSON 12: Approximating Changes in Height from Changes in Pressure

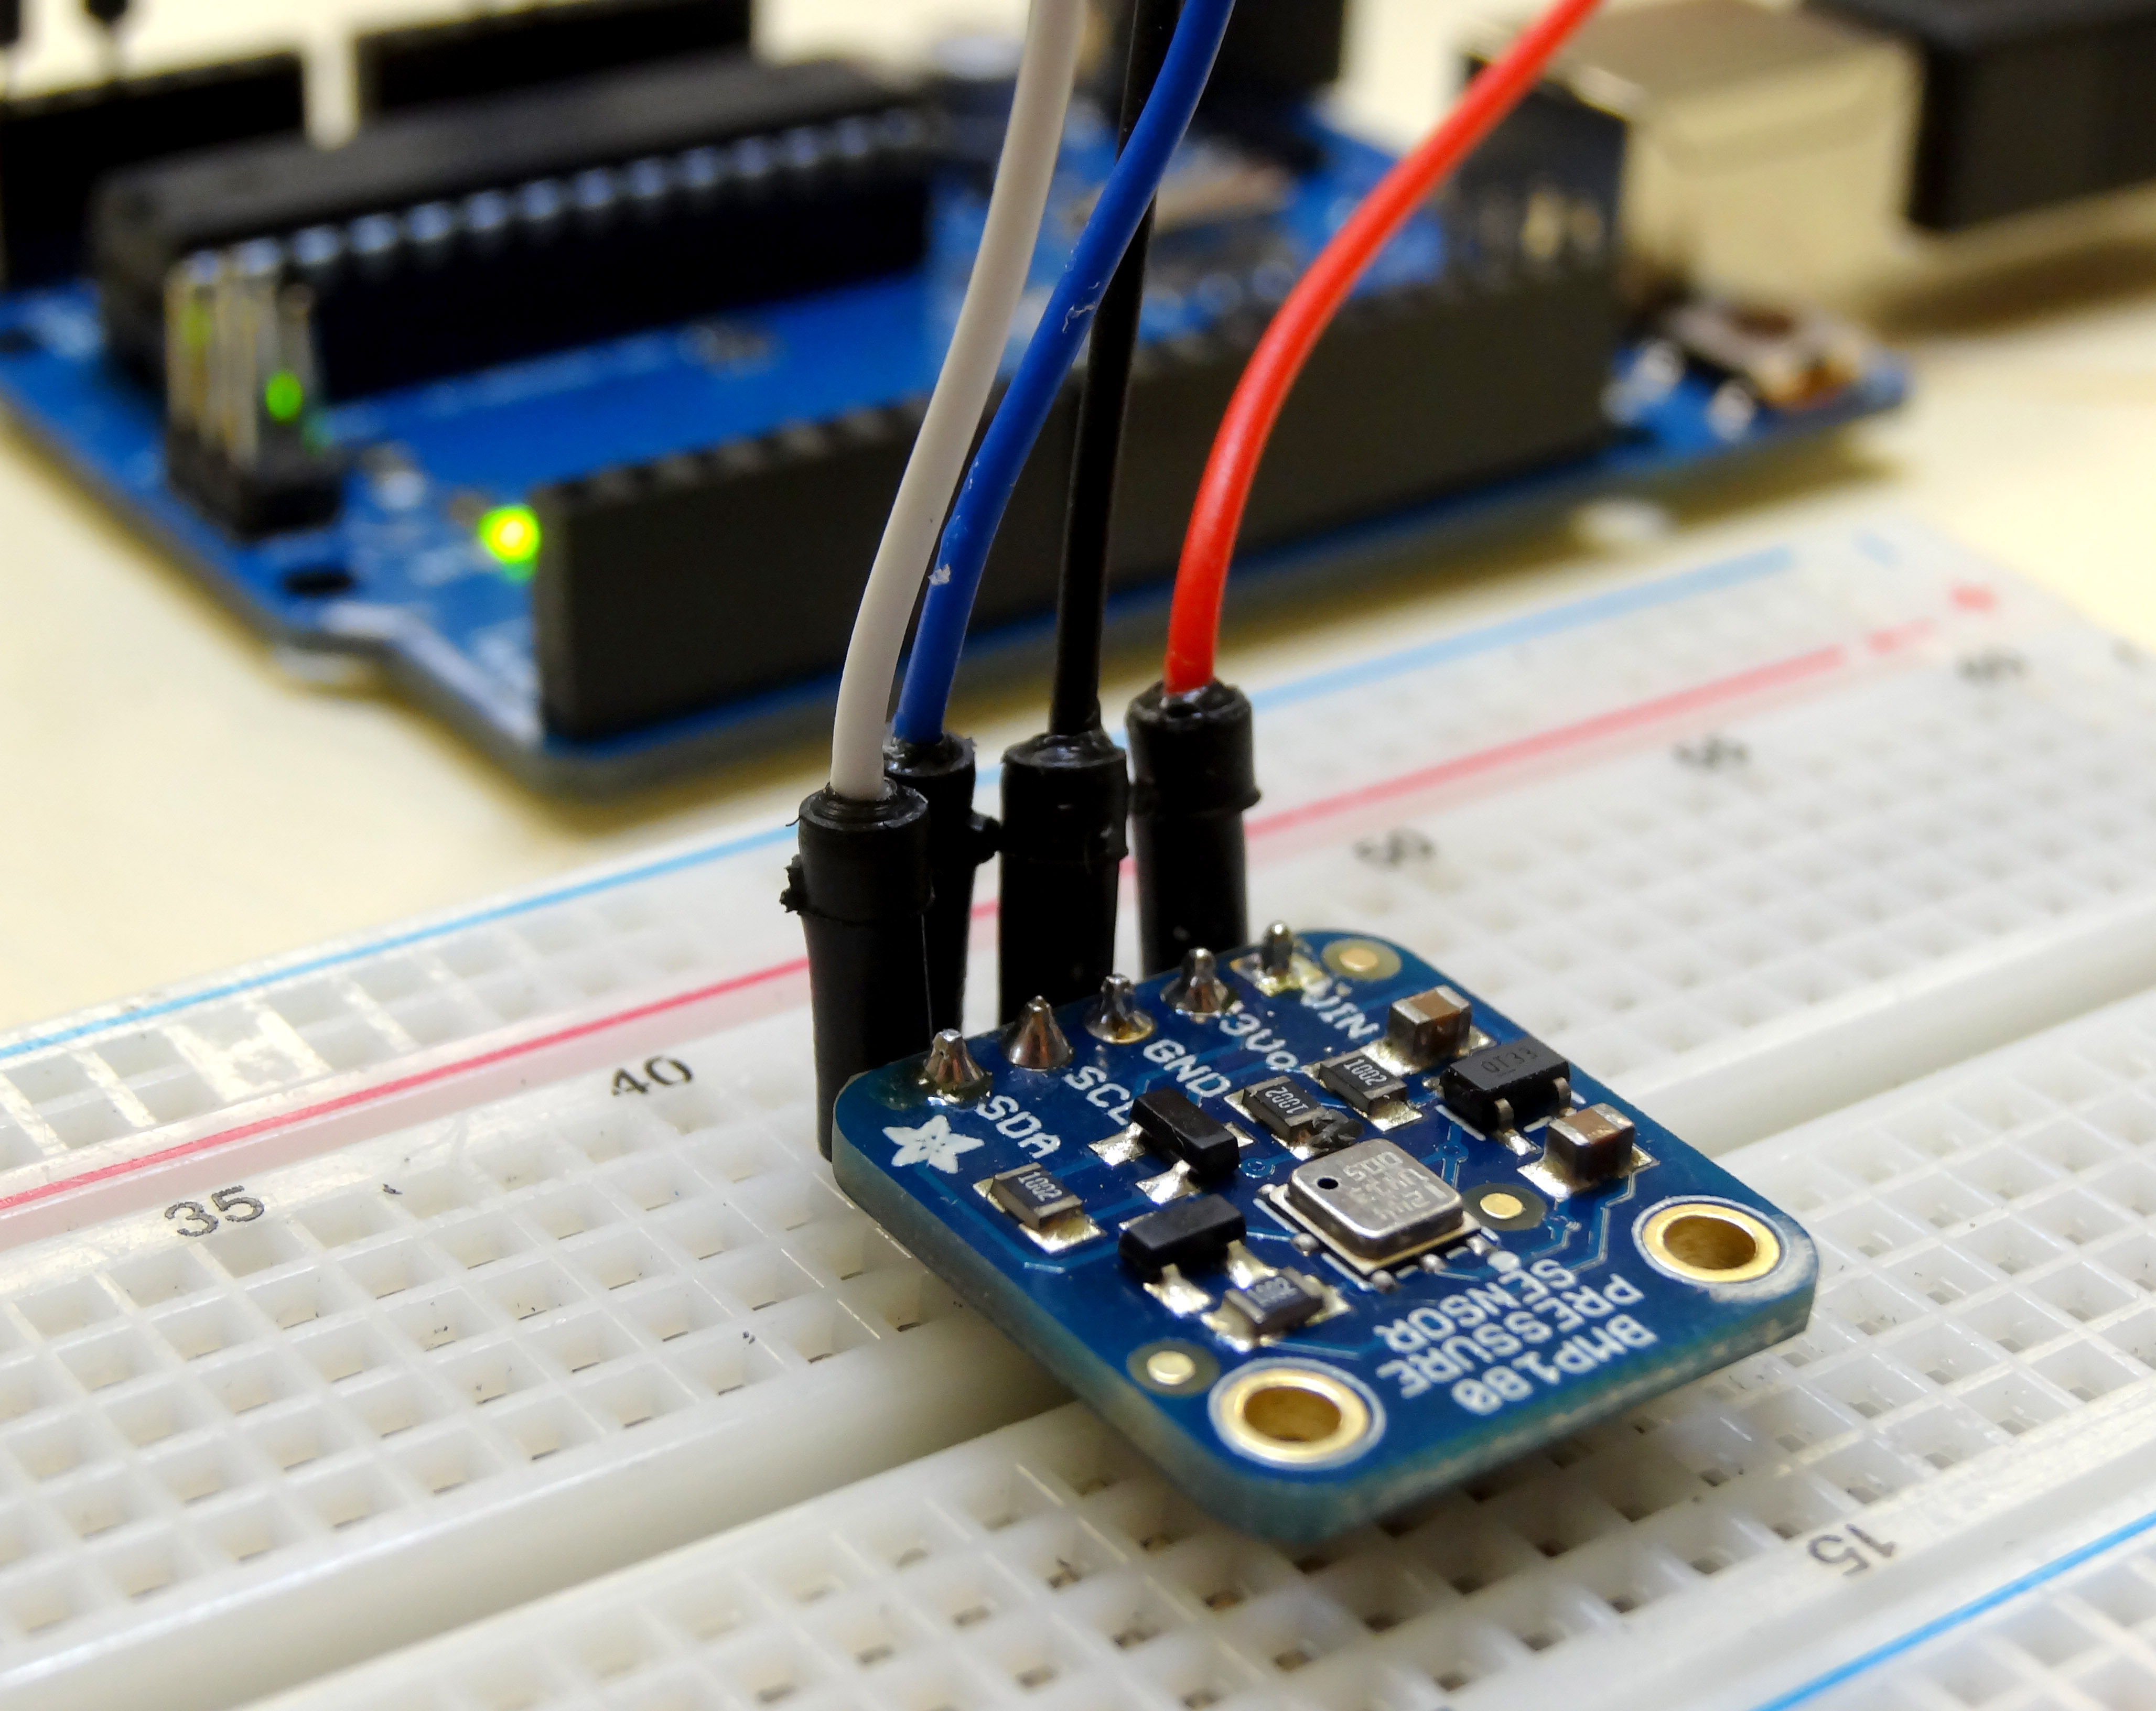
In LESSON 9 we learned how to hook up a BMP180 Pressure Sensor and make pressure and temperature readings. Then in LESSON 11 we learned how to stream that data to Matplotlib and create live graphs and charts of our data that update in real time. We could see that as we moved the pressure sensor up and down, we could see the pressure change, as the pressure decreases with increasing elevation.

This leads to the interesting question of whether we can use our circuit developed in LESSON 9 to create a Height-O-Meter . . . a simple device that will measure the height above the floor.

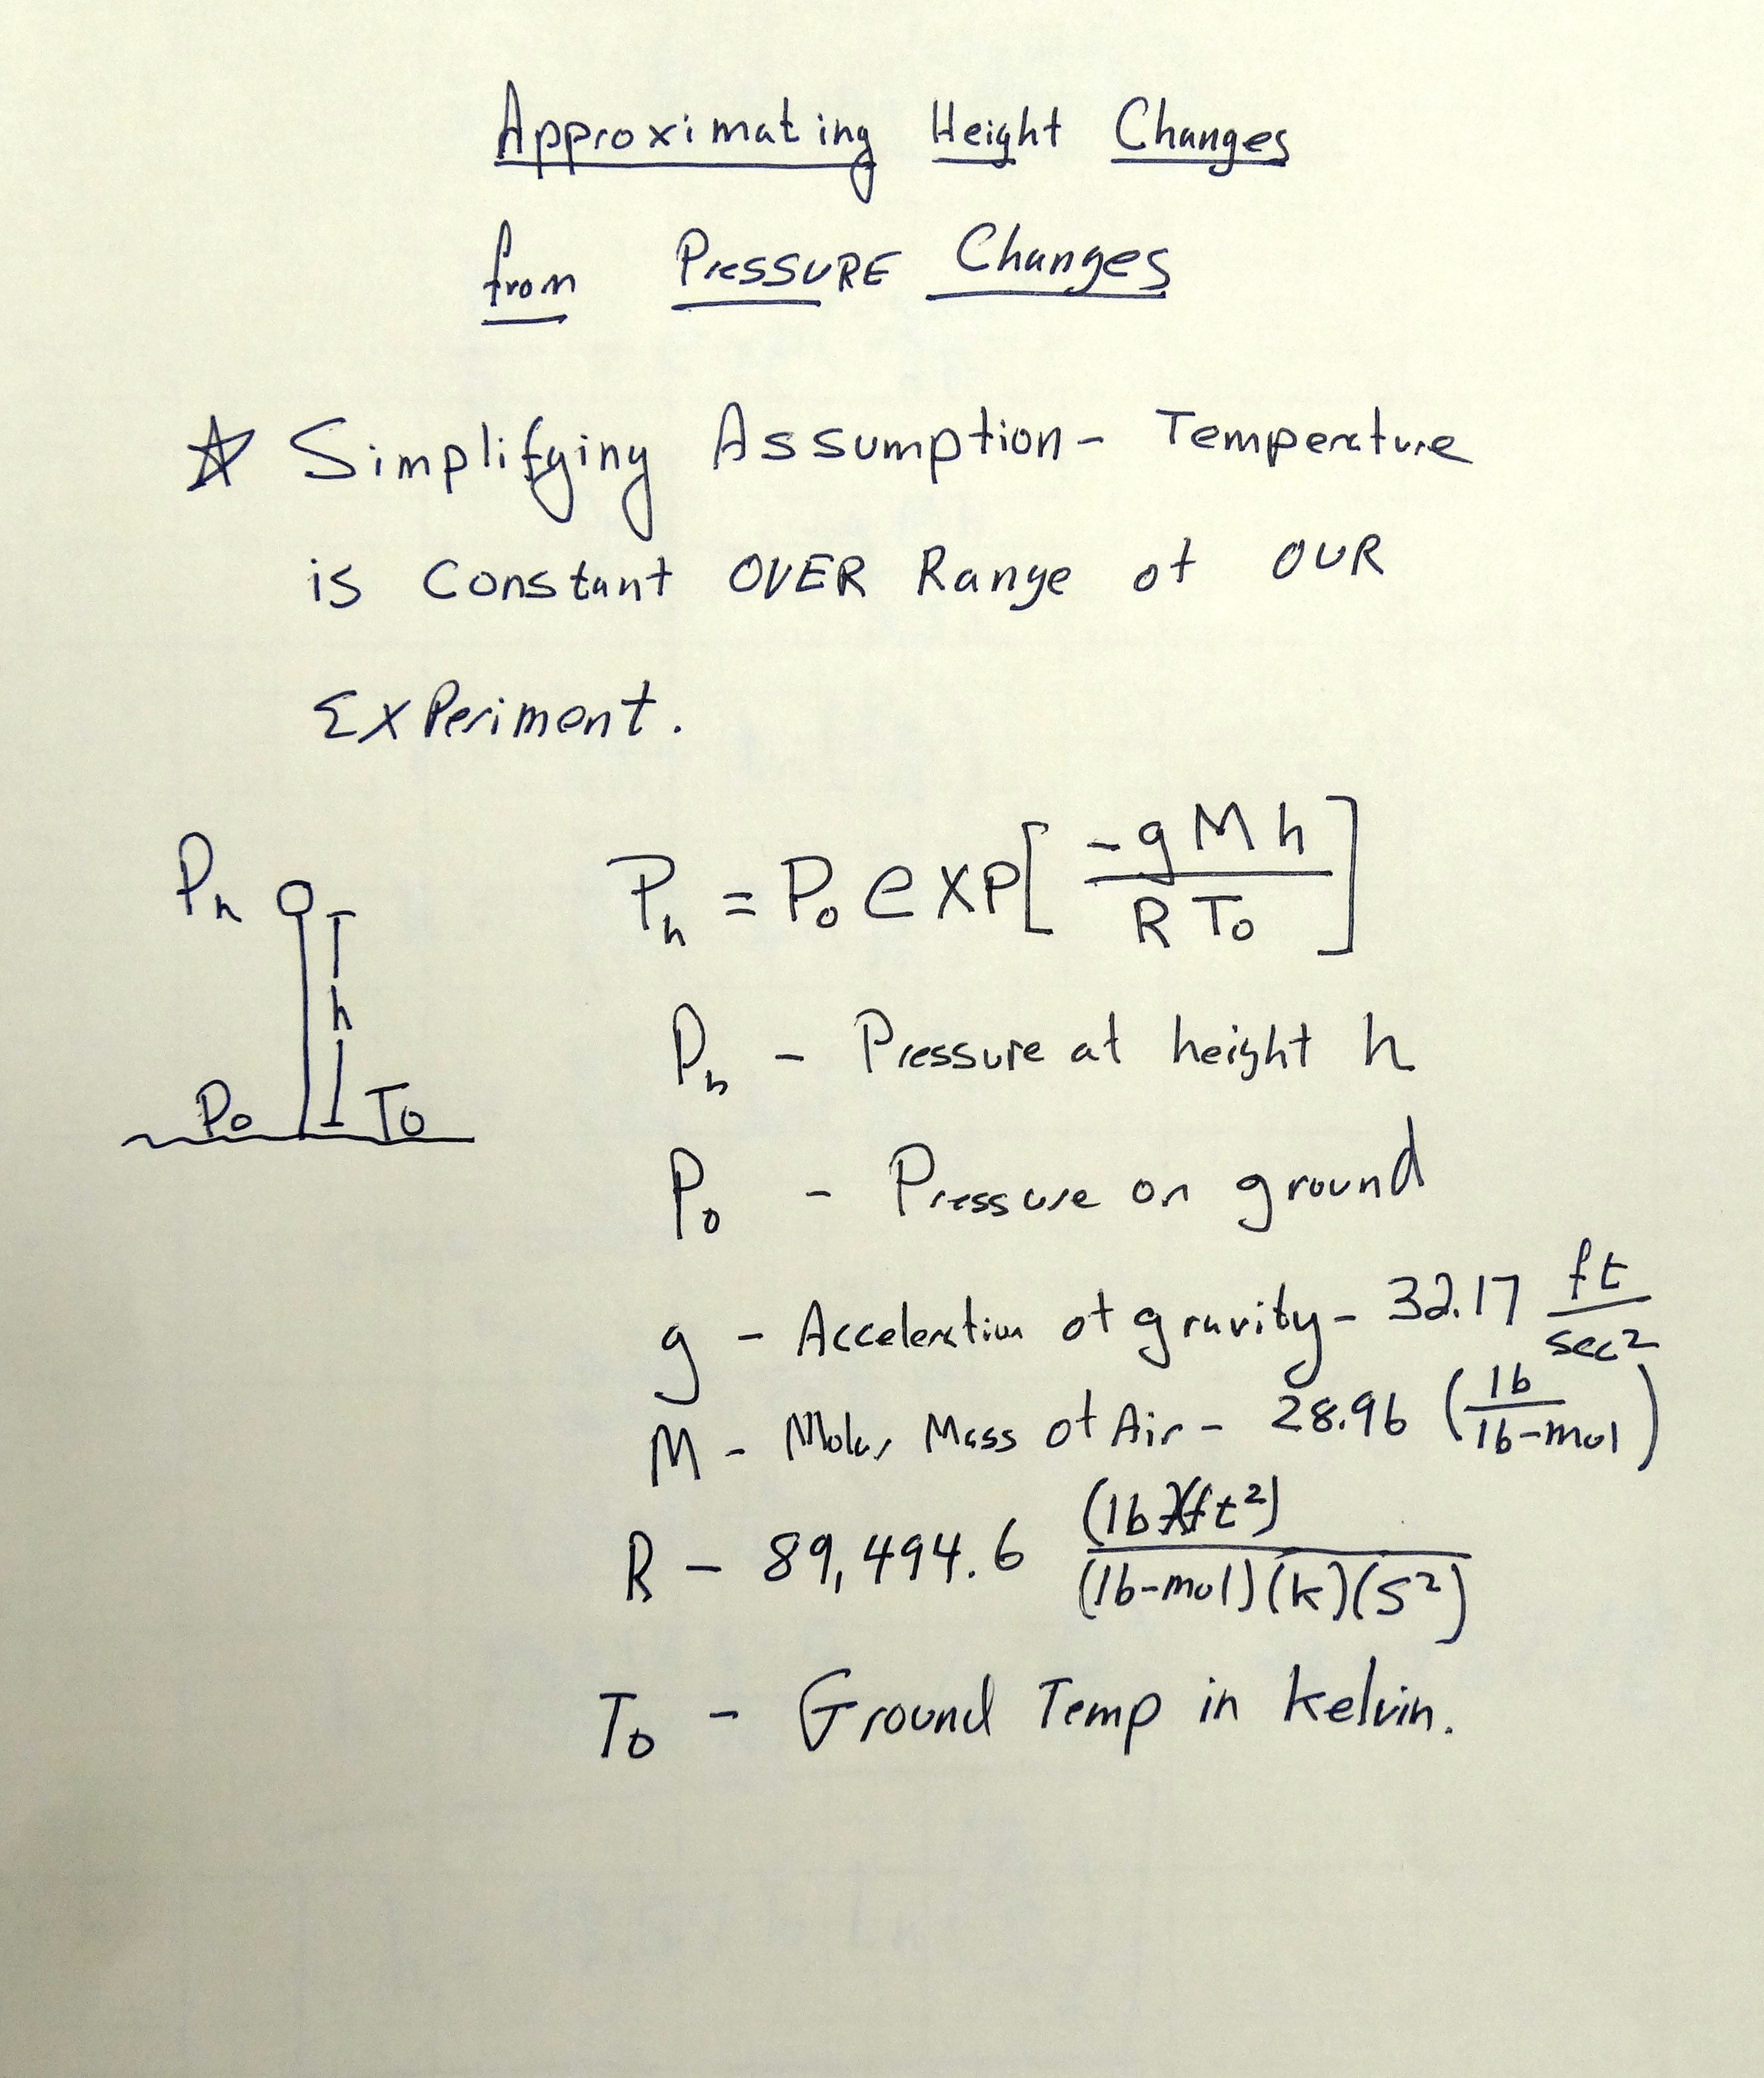
The math to calculate altitude vs. pressure turns out to be very complex. Particularly, if we wanted something for our high altitude balloon flights, or for model rocketry. It turns out that for the case of measuring height inside and for relatively small changes in height we can make simplifying assumptions that make things much easier. The assumption we will make is that temperature does not change much over the range of our experiment. With this assumption, we can create our own Height-O-Meter. To do this though, we do need to to through some math. I show my math below, and go through it step-by-step in the video. Remember, this simplified approach is only valid for playing around with small changes in height. We will have to do the more complicated math when we make our high altitude balloon probe. For now though, this math will work pretty well.

Height and Pressure
Calculate Changes in Height from Changes in Pressure

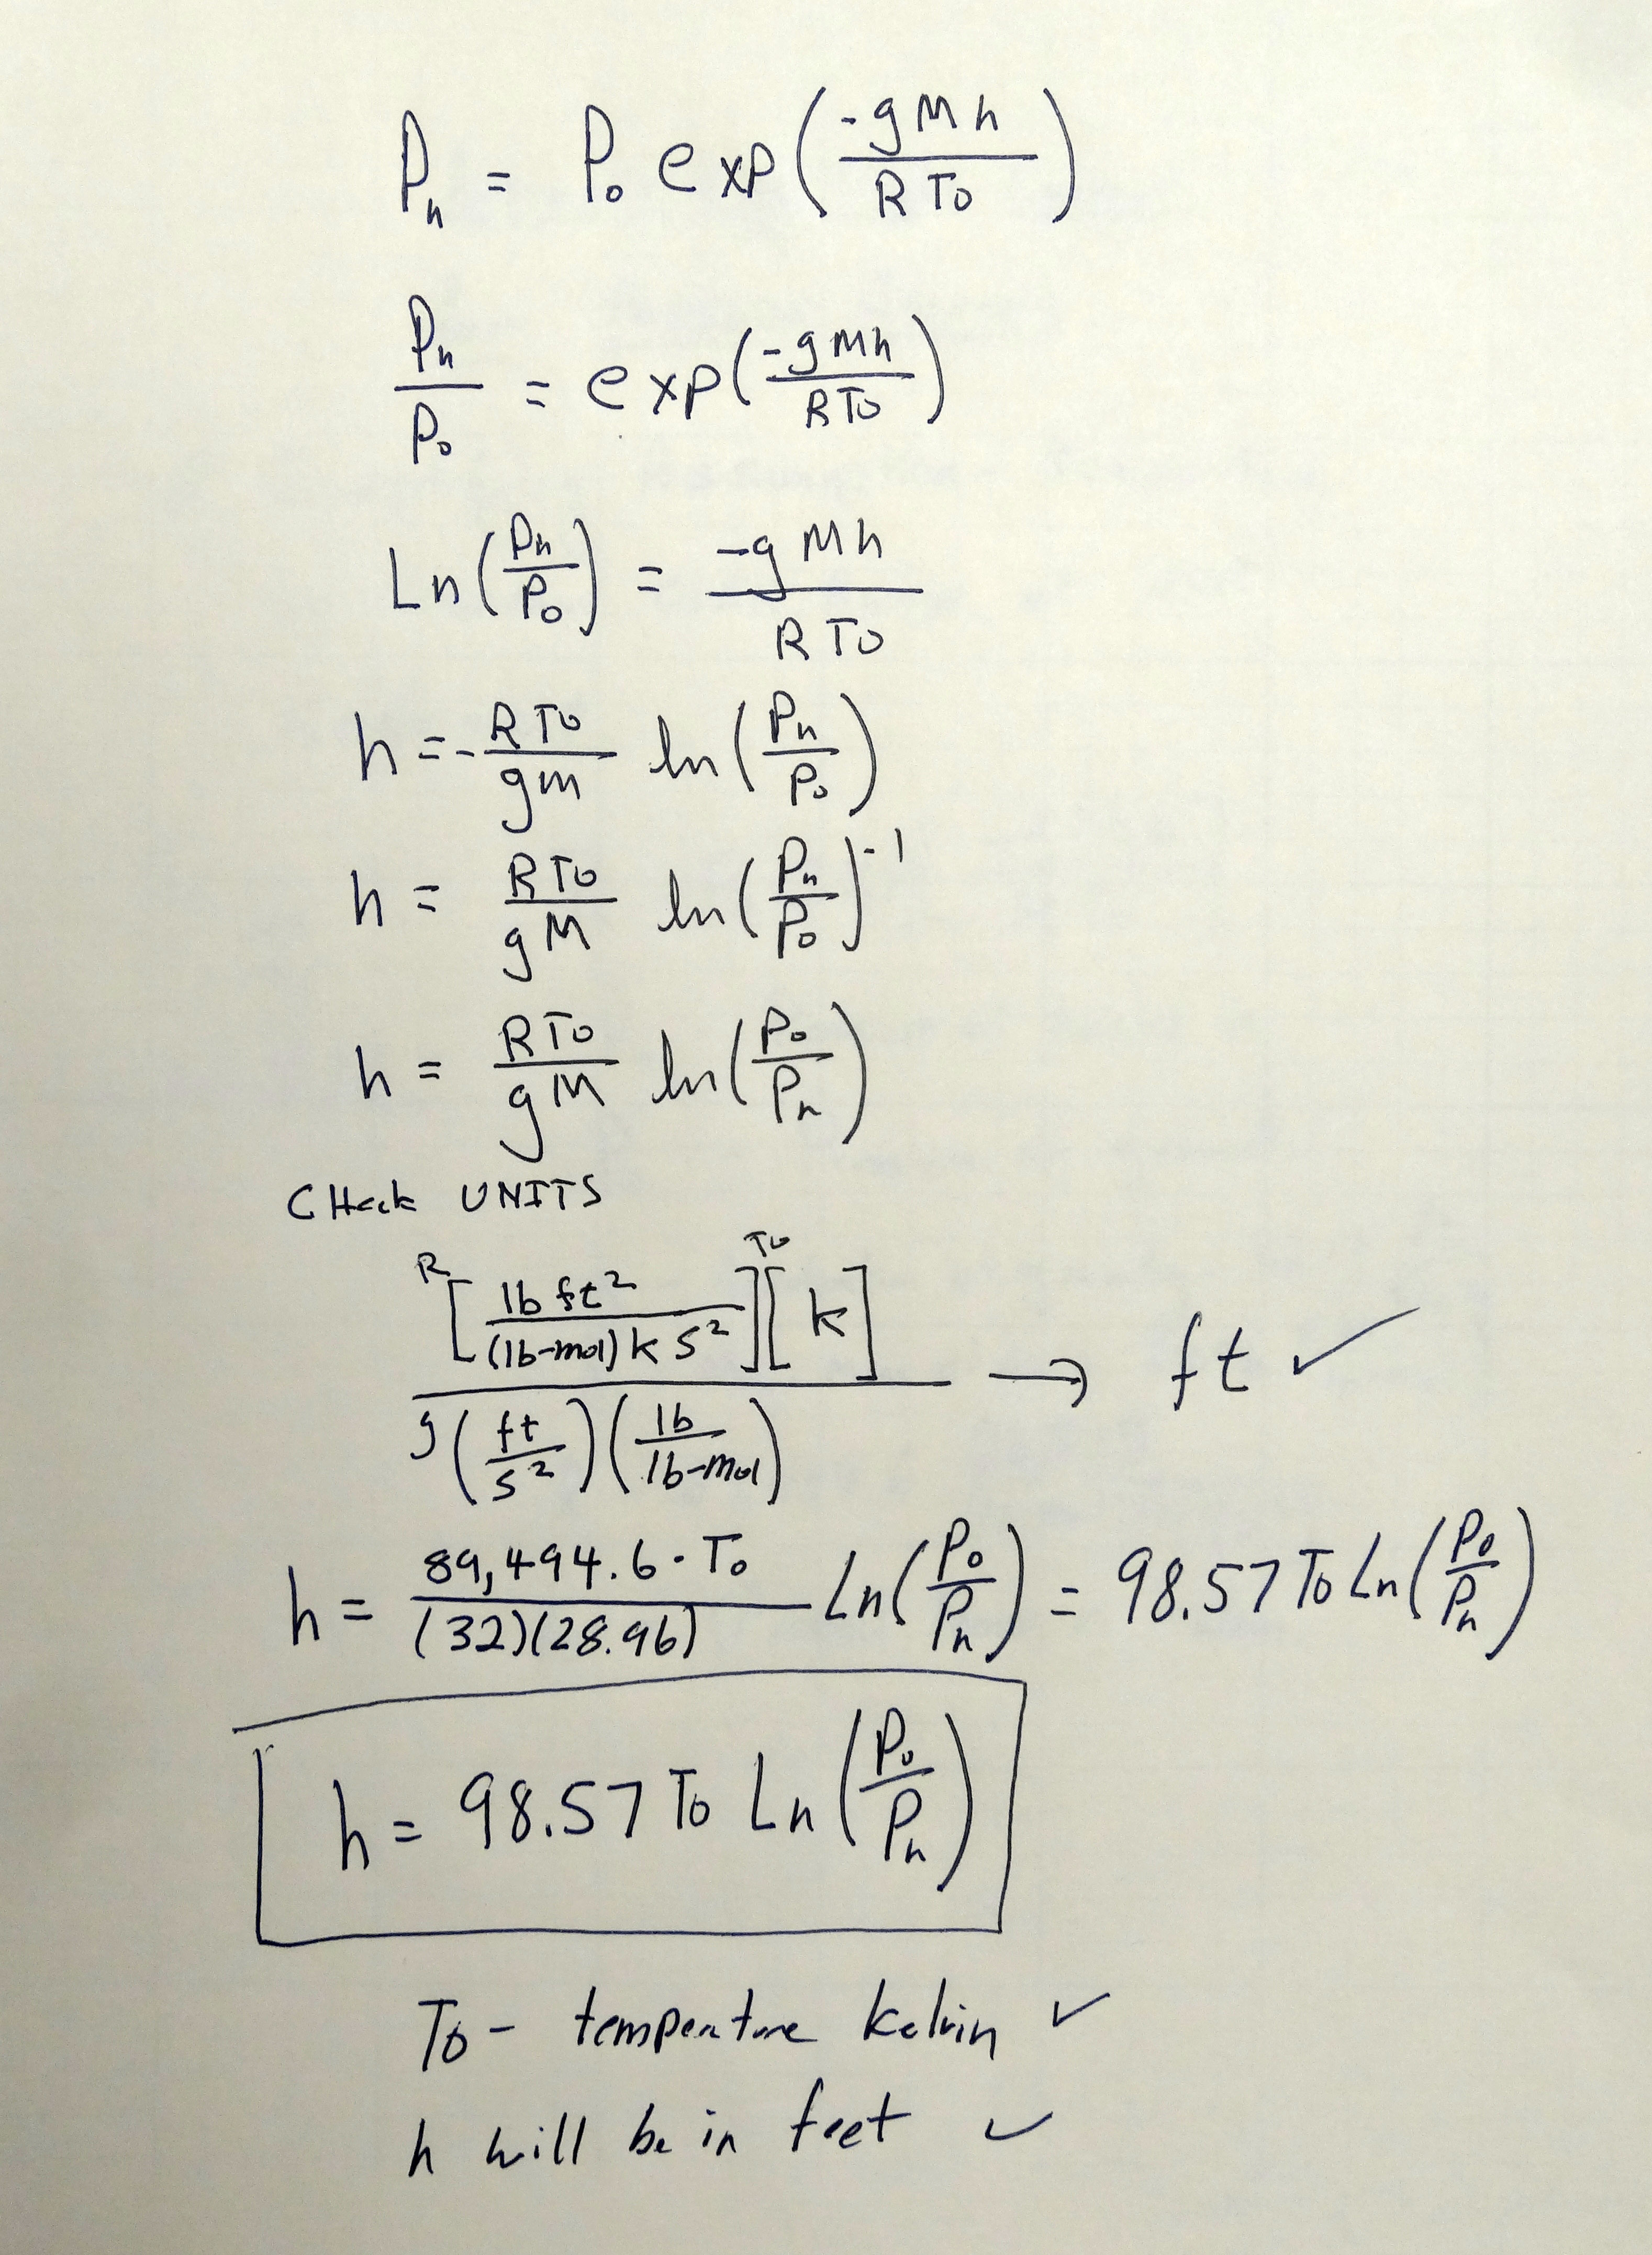
We can rearrange the equation to solve for height as a function of pressure.

Height Pressure
Calculating Height from Pressure Changes

Python with Arduino LESSON 11: Plotting and Graphing Live Data from Arduino with Matplotlib

We now have all the pieces put together to allow us to plot live data from the Arduino. If you have kept up with the earlier lessons, you will now have everything you need. If you have not done the earlier lessons, make sure you have python 2.7, vPython and pySerial installed from Python with Arduino LESSON 2.  Make sure you have installed matplotlib (Python with Arduino LESSON 7), and install drawnow (Python with Arduino LESSON 10). Also, you need to build the BMP180 circuit and get the arduino programmed up as explained in Python with Arduino LESSON 9. With this business taken care of, you are now ready to start plotting live data.

Pressure Data
This chart shows live pressure and temperature data being plotted in real time

We are using the Adafruit BMP180 pressure sensor.  We showed how to hook it up and program it in LESSON 9. As a reminder, we are using this code for the arduino. LESSON 9 explained in detail how the code works.

The video in this lesson above explains step-by-step how to develop the code on the Python side, and how matplotlib and drawnow work together to make live graphs and plots of data streaming from the arduino in real time. The code below is what we developed in the video. Do not simply cut and paste this code, but make sure that you understand it so you are able to create your own live graphing programs from scratch. If you are in my class, you will be required to be able to develop live graphing code like this from scratch, so don’t take a shortcut and copy and paste.

You should be seeing data like the graph on the top of this lesson. You will probably need to adjust your y-axis scale parameters in Python to ensure the scale is suitable for the data you are taking. If your chart is blank, likely your y-scales are not right for your data measurements.

Python with Arduino LESSON 9: Measuring Pressure and Temperature with the BMP180 Sensor

One of our goals with this series of lessons is to learn how to plot live data in Python. To do that, we need some interesting streaming data from the Arduino. In this lesson we will provide a live stream of temperature and pressure data. We will hook up the circuit, program the arduino, and stream the temperature and pressure data over the serial port. Then in the next lesson, we will read the data stream into Python, and provide a live plot of the incoming data. We will be using the Adafruit BMP180 Pressure Sensor.

BMP180
This is the most excellent BMP180 Pressure Sensor from adafruit.

This is a really simple sensor to get set up. To connect it up, use the following connections:

Connecting Up the BMP180 Pressure and Temperature Sensor
BMP180 PinArduino Pin
Vin5V
GNDGND
SCLA5
SDAA4


With the circuit hooked up, you are ready to start coding. The first thing you will need to do is to download and install the adafruit library for this component. I prefer the API V1 version of the library, so we will download that one. Do not worry that the documentation lists a different part number. This is an upgraded version of the sensor, and the documentation still references the old part number. You can download the library for this part here:

https://learn.adafruit.com/bmp085/using-the-bmp085

Click the “Download the Adafruit_BMP085 Arduino Library” large green box. This will download as a zip folder. Open the zip folder, and then drag and drop the contents on your desktop.  You want the contents of the zip folder, not the zip folder itself. Rename the folder you dropped to your desktop “adafruitBMP180”. Now you need to drag and drop this folder into your arduino library folder. To find your arduino library folder, in the arduino IDE window, look in file, preferences. A window should pop open, and it should show you where your arduino sketchbook folder is.  Drop your adafruitBMP180 folder into the Library folder of your arduino sketchbook folder. If this is not perfectly clear, watch the video above and you can watch me do it step-by-step. Once your adafruitBMP180 folder is in your arduino library folder, you are ready to start writing your code. You need to kill your arduino IDE window and reopen it for it to find your new library.

Now, to get this sensor to work, you just need a few lines of code. To begin with, you must load the Wire.h library and the Adafruit_BMP085.h library (again, do not worry that the library is named after an earlier model of this sensor).  After loading the libraries, you will need to create a sensor object. Then in void setup you will need to start the sensor, and then in void loop begin making measurements. The code below is a nice example of how to do this.

Now run the program and check your serial monitor and you should see measurements of temperature and pressure. Pressure in Pascals is a big number. To convert Pascals to inches of Mercury, or in Hg, which is what the weather sites usually report, take the Pascal reading, and divide by 3386.389. Then you should be in Inches of Mercury and you can check your reading against a weather report for your area. The numbers should be close.

Python with Arduino LESSON 8: Introduction to Graphing with Matplotlib

While it is cool to create 3D visuals using vPython to represent our data coming from arduino, sometimes we want to make more quantitative graphs and charts from the data. To do this, we need to learn how to create graphs in Python. We do this using the library Matplotlib. We learned how to install and download this library in Python with Arduino LESSON 7: If you have not installed the library yet, make sure to go back and do in as shown in LESSON 7.

With the library installed, we are ready to learn Matplotlib. The video takes you through an introductory tutorial with step-by-step instructions. The code below is a sample of how to plot a sin and cos wave. You can watch the video, and then play around with the parameters to become familiar with this library.


Python with Arduino LESSON 6: Installing PIP on Windows

In this series of lessons you have learned to send data from Arduino to Python, and then do some pretty cool things in Python. We have created little virtual worlds, and have done neat dynamic graphics. Unfortunately not all Python libraries are as easy to install as vPython and pySerial. Some are next to impossible to install. The good news is that there is a free program called PIP that will install just about any Python library very easily. We need to pause and install PIP. Many of the future lessons will require you to have PIP installed on your machine. Please follow along with me on the video, which shows you how to install PIP on your windows machine. These links will be useful. You can download pip at this link:

https://pip.pypa.io/en/latest/installing.html

Go to the section on PIP install as seen here:

Install PIP

Right mouse click on get-pip.py and download to your desktop. You will then want to run the program in python. We show you how to do this in the video above. Then, you need to edit your system path file by going to the control panel, select system, select advanced settings, and under environmental parameters select the path. Update your path file to show your system where your python folder is and where your python script folder is. If you are unsure of this, watch the video where I show you exactly how to do it. If you are adept with computers, you can just do it from this description. Add the two elements to your path. Adjust the parameters to reflect where your python installation is and where your python script folder is. For me, these are the two things added to my path:

C:\Python27

and

C:\Python27\Scripts

If you do not know exactly what I am saying, then watch the video for more detail.

Once you have these in your system path, you can test your PIP as follows.

Open a CMD box.

Type:

pip install -U pip

This asks pip to update itself. You should see it come up and indicate it is either up to date or is updating. This will tell you that you have the PIP installed correctly.

Your life with Python will now be much easier because your system now knows the path to both your Python program and your PIP installer.